Category: News
I promised an update when August sales figures came in, so here goes.
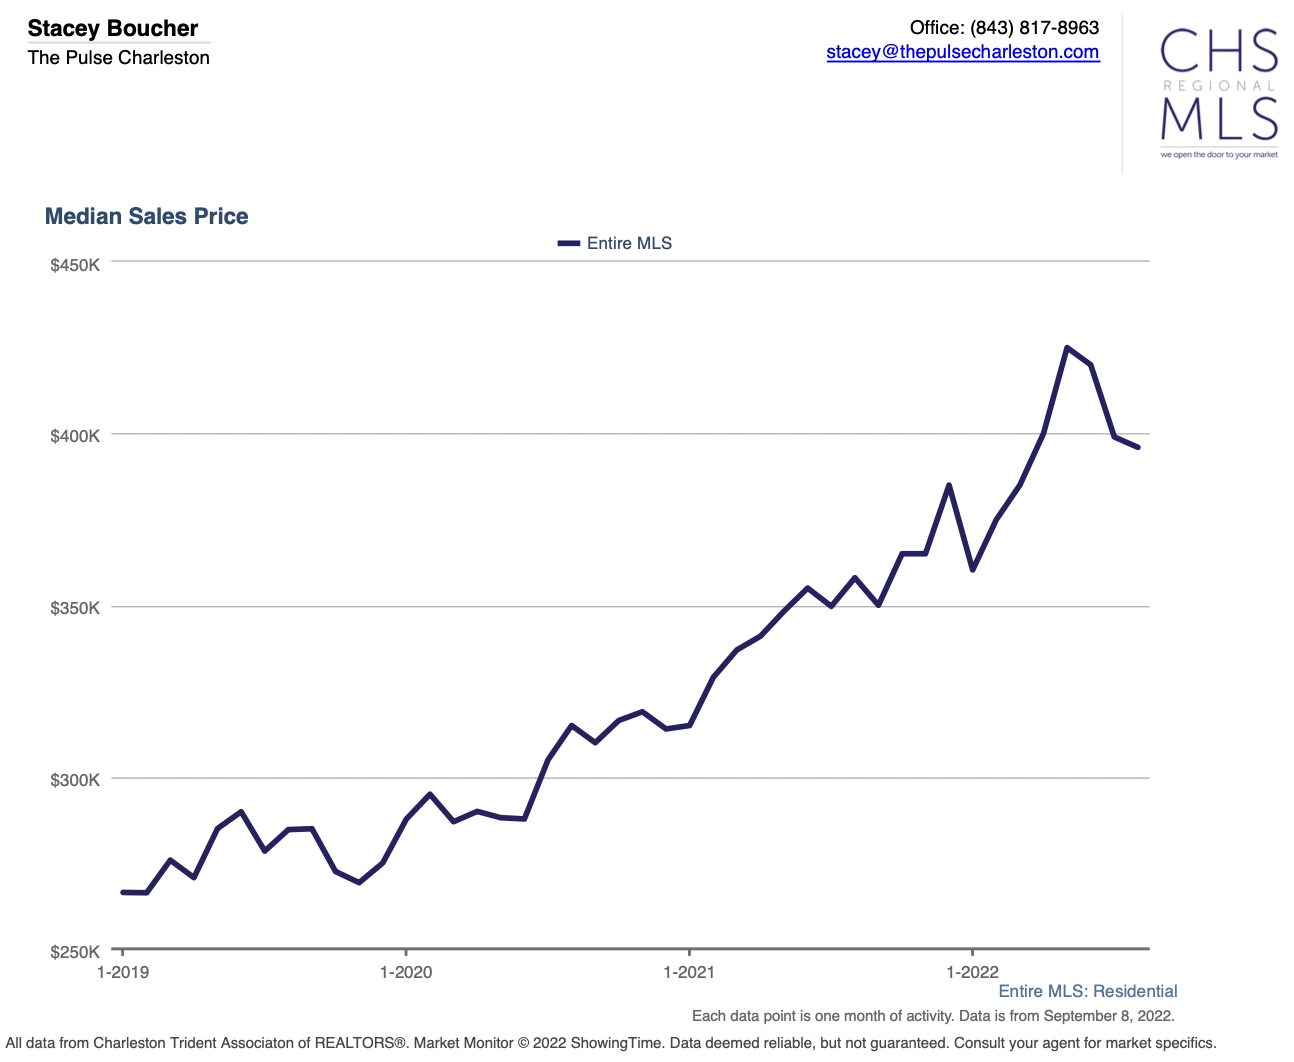
The Charleston residential real estate market saw a further decrease in median sales price, $399,000 to $395,963 from July to August. From our May high of $425,000, we have dropped approximately 6.8%. But the decrease from July to August was a lot smaller compared to previous months, and I have some thoughts as to why it has slowed.
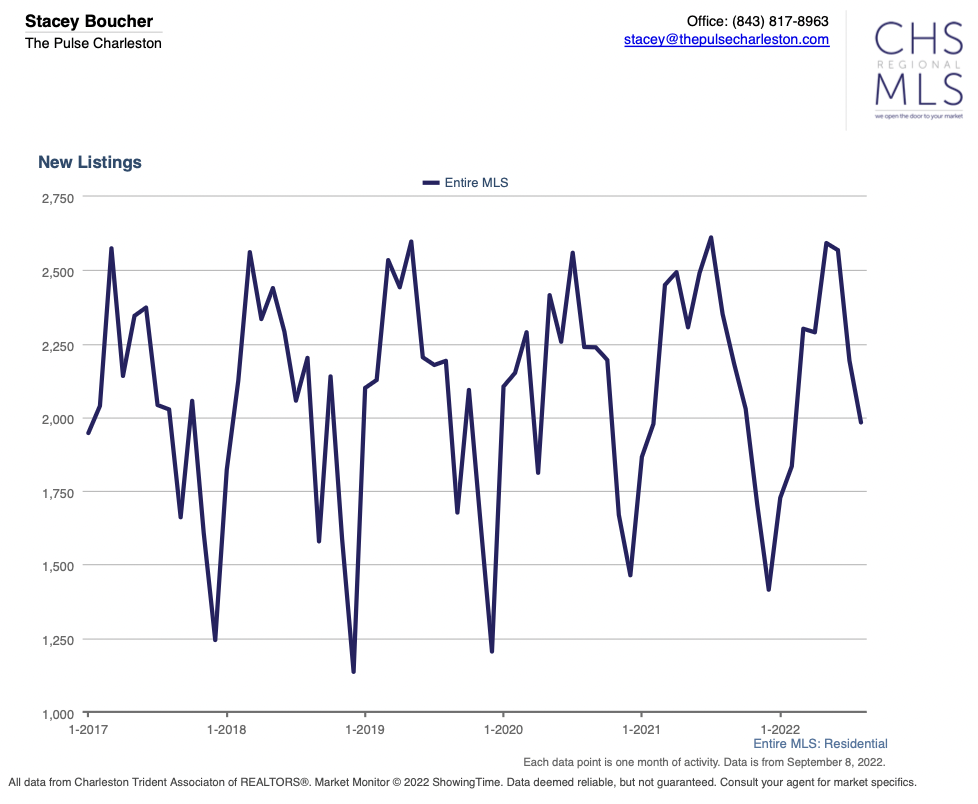
New listings are dropping significantly, and I think there are multiple factors contributing to this decrease.
Historically, new listings drop in the fall. Common knowledge is that spring is the best time to sell, so many sellers prefer to list in the spring. Many buyers make their moves following school schedules, preferring to be in and settled before school starts back up in the fall.
Many buyers and sellers do not want to move during the holiday season, a typically busy time of the year for just about everybody.
While this does not affect us too much here in Charleston, bad weather is another driver of spring listings. Exterior listing photos look better with green grass and flowers, not snow or bad weather. Christmas decorations in photos are also a big risk. If a house does not sell as quickly as planned, come January, that Christmas tree in the photo can be a big deterrent to buyers, a blatant reminder that this is a stale listing, and there may be something wrong with the house. Ever hear the saying, “I don’t want to buy it if nobody else wants it”? The same psychology applies to real estate sales.
I also think sellers may be sniffing out that the peak for prices may have passed. With rising interest rates, the buyer pool is dwindling, and there is downward pressure on prices. To move, sellers would have to accept a much higher mortgage payment than they are used to. National rates are hitting their highest levels since 2008. In comparison to today’s rates, if one bought their current home just one year ago, prices were significantly lower and rates hovered around 3%. With current prices at higher rates, a seller would have to accept a 60% increase in monthly payment in just one year, and that doesn’t include taxes and insurance which also rise when home prices increase. That sure would make me think twice about moving!
With new listings decreasing, we will see added pressure on our already low supply of homes to sell. Low supply puts upward pressure on prices again.
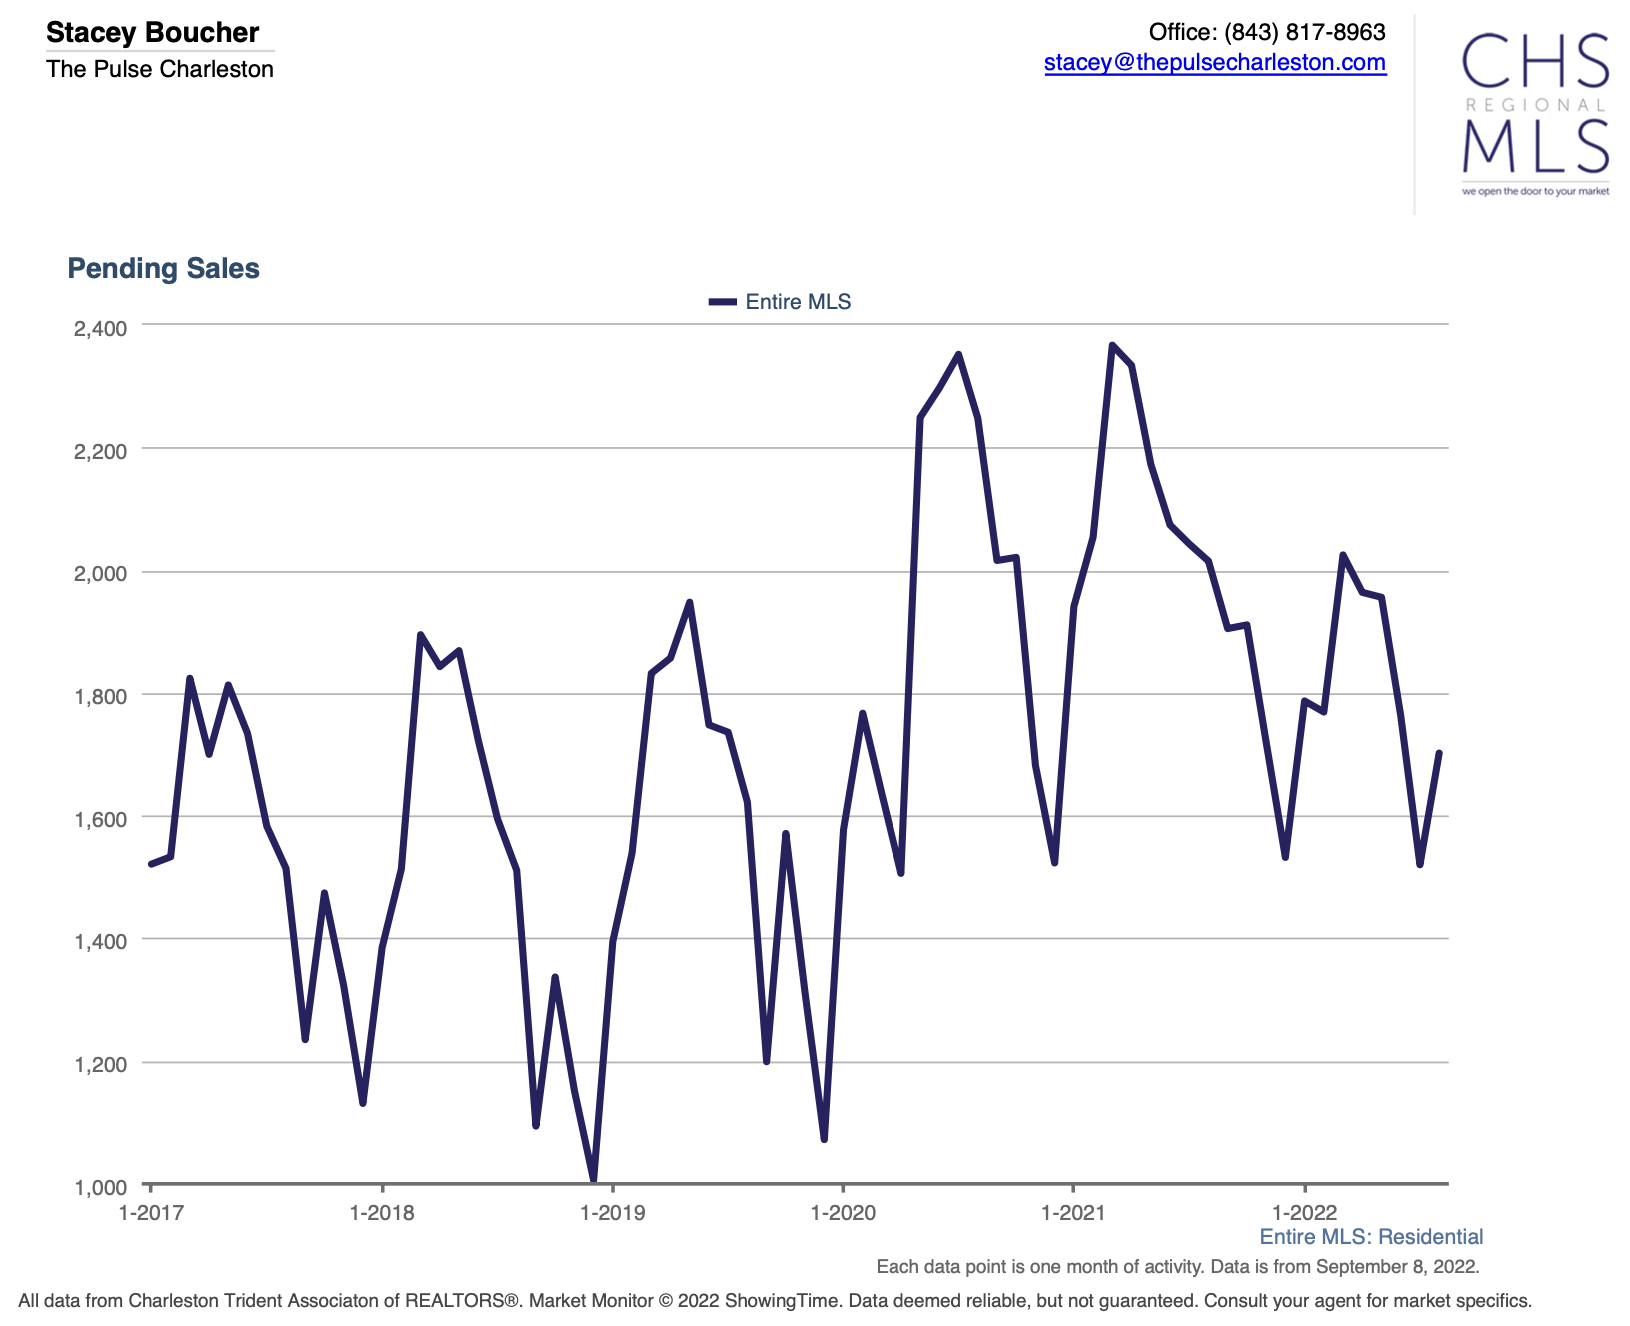
Another factor slowing the decline in prices is that pending sales were up last month. Why? Not 100% sure, but my guess is that interest rates dipped just enough to drive enough buyers off the sidelines who were thinking about moving in the spring but were deterred when rates rose so quickly. Having had time to internalize the increase, that small interest rate drop may have propelled some to take the leap. Another idea that crossed my mind is that new home builders are feeling the crunch nationally and are back to offering some great incentives to build a home today. I have even seen some home builders offering to buy down interest rates for buyers. That might be enough to entice me!
In recent years, pending sales have increased from September to October in our area before heading lower in November and December again. Why? I think buyers are back from summer trips and through the craziness of the school year beginning, and it is the last-ditch effort to get in before the holiday season starts. Maybe we just started earlier than normal with all the attention the housing market has received lately. It is very possible that pending sales will keep heading north for the next couple of months as well.
Where does that take prices for the rest of the year and into the first quarter of 2023? My best guess is slowly declining, stagnant, or slowly rising, unless rising rates hinder demand further or cause economic deterioration enough to scare people about the possibility of job loss. Our supply is just not rising quickly enough, in my opinion, to see larger price moves.
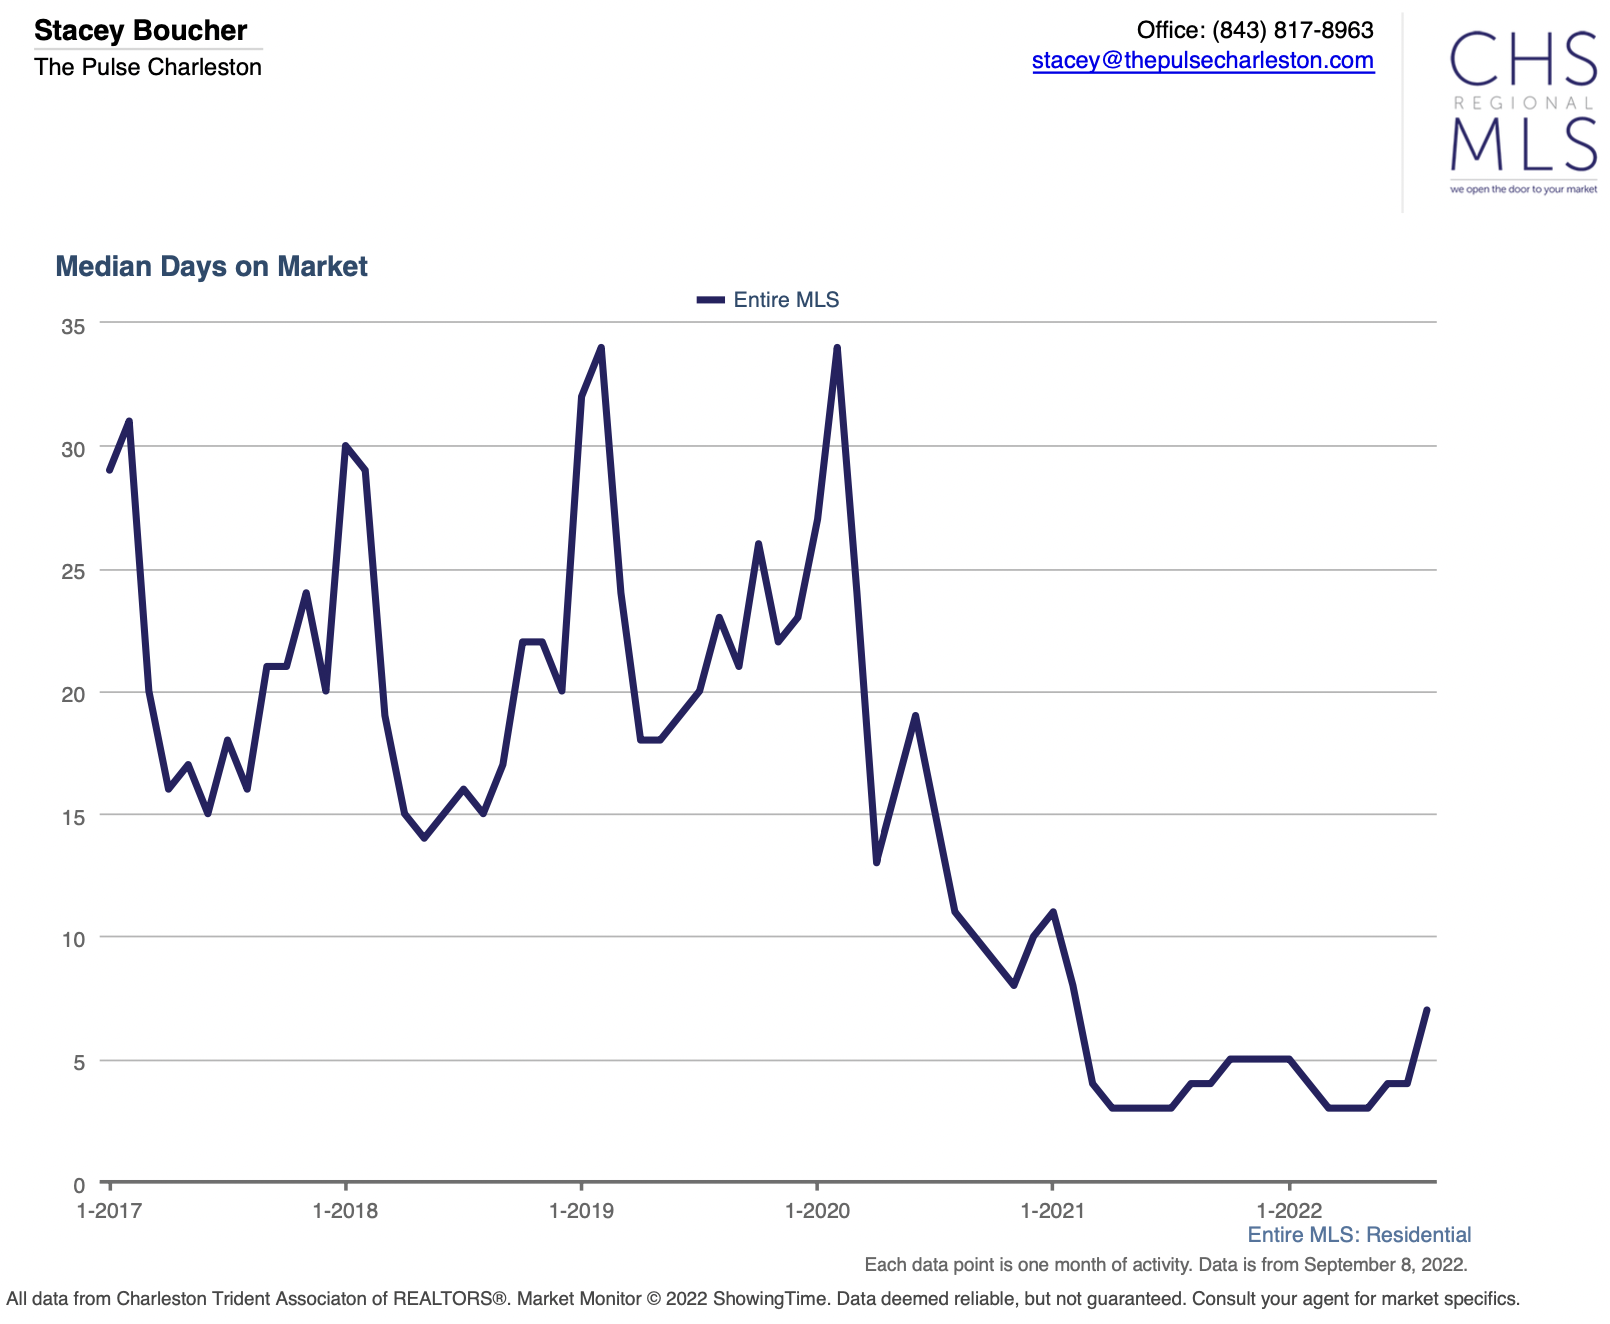
Is it a good time to sell now? I think so. It is taking just a bit longer to sell, but not much longer. With active listings heading down again, sellers may be back in charge for the time being. We will know more when September and October data is released.
There is no question in my mind that the real estate market is changing. After a whirlwind last two years and the astounding price appreciation we have seen in the Charleston real estate market, buyers and Realtors alike are waiting for some relief. This cannot go on forever, right? Eventually, the music needs to stop, and the party needs to be broken up before inevitable damage is done.
But making definitive statements about future prices is not something I am willing to do…yet. I, of course, have my theories which are growing stronger each day, but that is basically all I have…a story I am telling myself. I am starting to get calls from loan officers looking for business, agents are slashing prices finally, I am back to making my kids’ breakfasts, and I have time to write a blog post. The news stories are now turning negative, and the sentiment is getting lower every day.
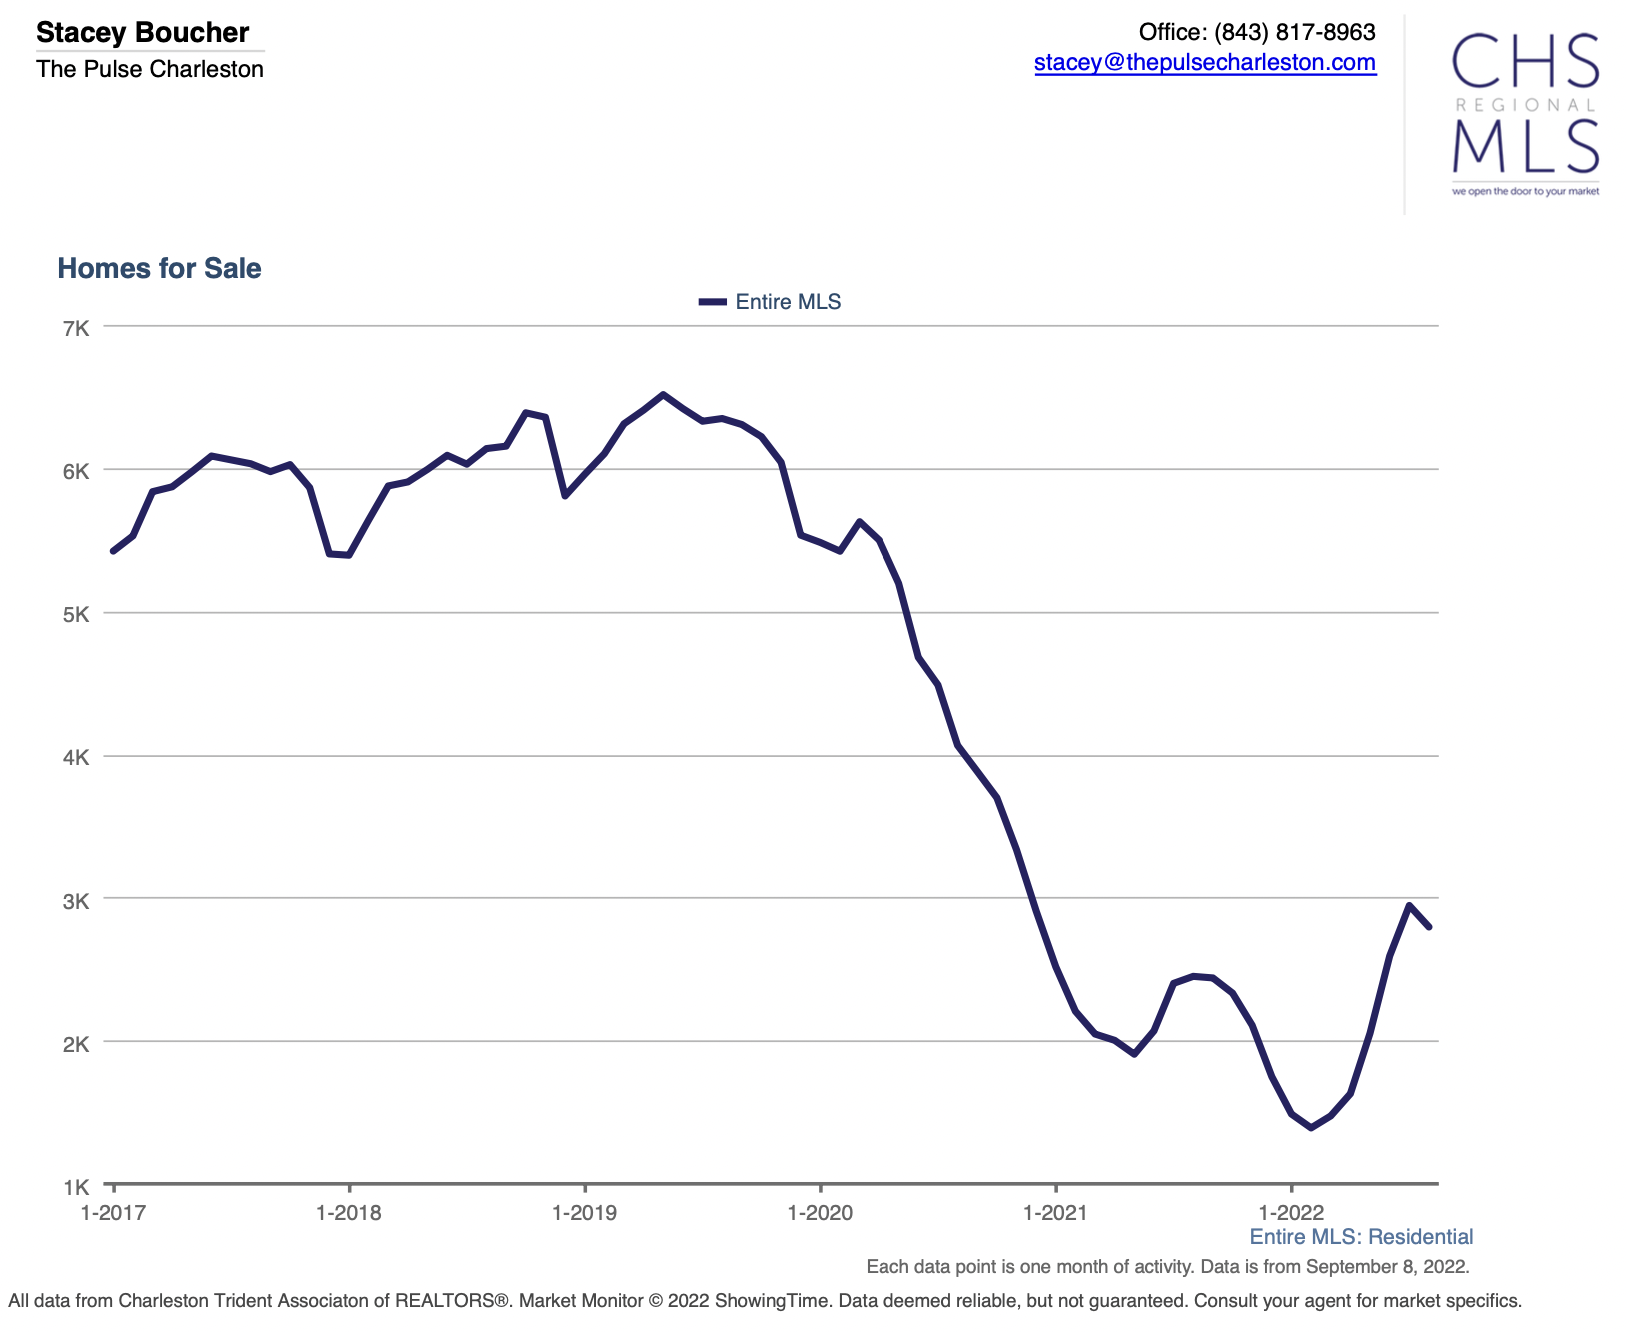
As a Realtor, I have access to a lot of data that I like to overanalyze ad nauseam. I am a numbers person and would gladly stare at charts all day and theorize. Plus, as the Broker of a company, I feel like it is my duty to keep my agents abreast of the changes in our market, whether they welcome the info or not. In my opinion, we do not yet have enough data to make significant and accurate conclusions about the direction prices are headed towards in our real estate market. Further data for August should come out in the next week or so but waiting to see the September and October data will provide much clearer info to solidify a larger trend. I was looking at this particular chart below the other day that is available through our MLS, and that big drop from May to July is looking quite ominous. Is this the telltale sign that the market has topped?
Well, maybe for the immediate future, but not necessarily for the rest of the year. When you look at the rest of the chart and start working on some quick calculations, you will notice that we always have a summer slump before another leg up in the fall. In 2017, we had a 5% dip in median price from July to August. In 2018, we had a 5% dip from May to August. 2018 is a fun year to analyze because we were in a similar rate hiking environment like we currently are in. In 2019, we had a 4% dip from June to July. And then Covid came to town and really changed the dynamics. Even though we were booming with price appreciation, we still had slight summer slumps. The median price dipped 1.5% from August to September in 2020, which was a little late for the summer slump, but the market was weird that year. With the spring being basically off the table for showings, it makes sense that the season was extended. In 2021, we had a 1.5% dip from June to July too, and now we are talking about the craziest market I have ever seen.
So yes, here we are in 2022, and we have a 6% dip from May to July. That is not an insane percentage if you look at the historical data.
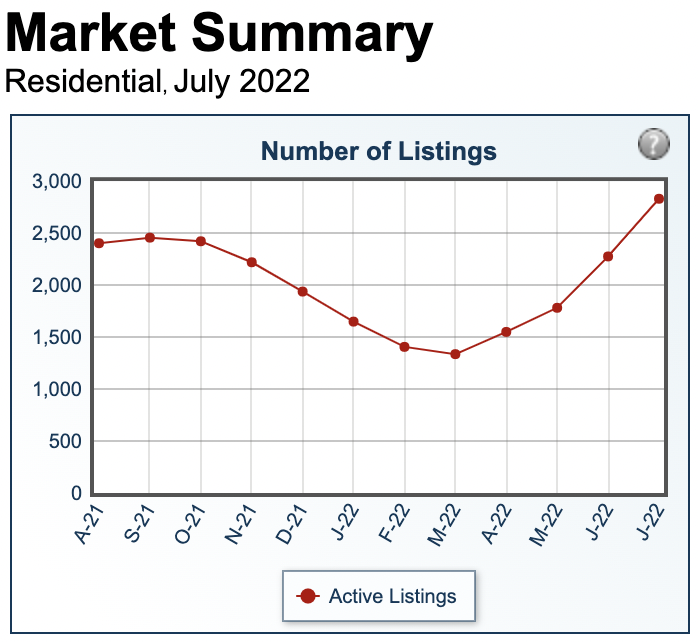
We still have a low inventory problem, and the unemployment rate in Charleston is 3% as of June, according to U.S. Bureau of Labor Statistics. All good metrics for further price appreciation ahead, but the macroeconomic environment is very murky and changing daily. From the March lows, inventory has been rising along with the increase in interest rates. According to this chart below taken from the MLS, we saw a 16% gain from March to April, 15% from April to May, 28% from May to June, and almost 24% from June to July.
I have been tracking levels in August, and although we are still adding, the accumulation rate is slowing pretty significantly. We have a long way to go before levels scream buyer’s market. Although unemployment is ticking up slightly from the April low of 2.3% (link), I suspect a more significant move in the unemployment rate would need to come first to swing the pendulum in the other direction from a seller’s market.
As you can tell, I am not willing to say with certainty where our median prices are heading. The summer slump exists, and we are definitely feeling it, but fall is right around the corner. We will keep you posted when the crystal ball gets clearer.
Alright, peeps. This is the second time this week I have been asked by a buyer if they should prolong buying a home until we see that flood of foreclosures hit the market after the mortgage forbearance programs end on June 30th. Shouldn’t buyers wait to purchase when the real estate market crashes?
The short answer is no, but do not worry, I am going to get into it below if you want a longer answer.
I know where buyers are getting this information because I have been seeing a lot of articles too with many industry analysts forecasting a looming “tsunami” of foreclosures on the horizon.
“A wave of foreclosures is likely coming that will hit low-income homeowners. As of August, over 10% of the eight million single-family mortgages backed by the Federal Housing Administration were delinquent by more than three months.” – Michael Strain, Bloomberg
It is true that millions have lost their jobs permanently during the pandemic, so it would be safe and obvious to assume that we will see some future foreclosures, so why am I not forecasting a wave?
1. Many home owners entered the forbearance program out of caution and not actual need. Spring 2020 was a scary time for many, including me. I did not expect to sell many homes last year at all. Many were scared they were going to lose their job. When these current mortgage forbearance programs originated, they were advertised as “no penalty” programs and did not require borrowers to show proof of hardship. Why not exercise caution and enter the program just in case of future job losses? I think many chose this option as the safest route and did not actually need the help.
2. In fact, many defaulters have had their loans reinstated and are already exiting the program. According to the Mortgage Bankers Association (MBA), about 2.7 million U.S. mortgage borrowers, or 5.5% of the total, were in forbearance programs as of January 3, 2021, down from the 8.6% peak in June 2020. While experts assumed the millions who entered the program would eventually go into foreclosure, that just has not been the case.
3. Banks are being more flexible with repayment plans. In the past, if you were in forbearance, and you came to the end of that period, a balloon payment might be expected to reinstate your loan. Many banks have learned from the last mortgage crisis and are not operating like this anymore. Many are just adding the missed payments to the end of the loan period, which is a lot easier on strained homeowners.
4. Loan quality is a lot higher today than in 2008. Prior to the pandemic, foreclosure and unemployment rates were at all time low levels. Gone are the days of reckless lending and stated income. If you want a home these days, you are going to be well qualified. Well qualified mortgagors do not tend to go into foreclosure.
5. Industries where job losses have been high tend to have hourly wage employees with lower homeownership rates already. A lot of people who lost their jobs were concentrated in a handful of industries —tourism, hospitality, retail, restaurants, travel. The majority of home owners have not seen the job losses that could have accompanied this pandemic, so they have been able to afford their mortgages.
6. The money keeps coming in. How many stimulus checks have I received now? I think we are going on three stimulus checks, PPP loans, EIDL Advance funds, etc. There has been help for people struggling to keep up with their mortgages.
7. Low inventory levels, low interest rates, and a lot of equity. To me, this is the biggest factor I would use to predict how many foreclosures we will see. With housing inventory being at rock bottom levels, and interest rates increasing the demand, why not just list your home for sale instead of going into foreclosure? With price appreciation alone increasing 10% in 2020, maybe refinance and take some money out of the house to stave off a disaster? There are more ways to avoid foreclosure in 2021 than 2008.
“With enough equity, a homeowner has the option of selling their home, or tapping into their equity through a refinance, to help weather the economic shock. It is a lack of sufficient equity, the second component of the dual trigger, that causes a serious delinquency to become a foreclosure.” – Odeta Kushi, First American Economic Center
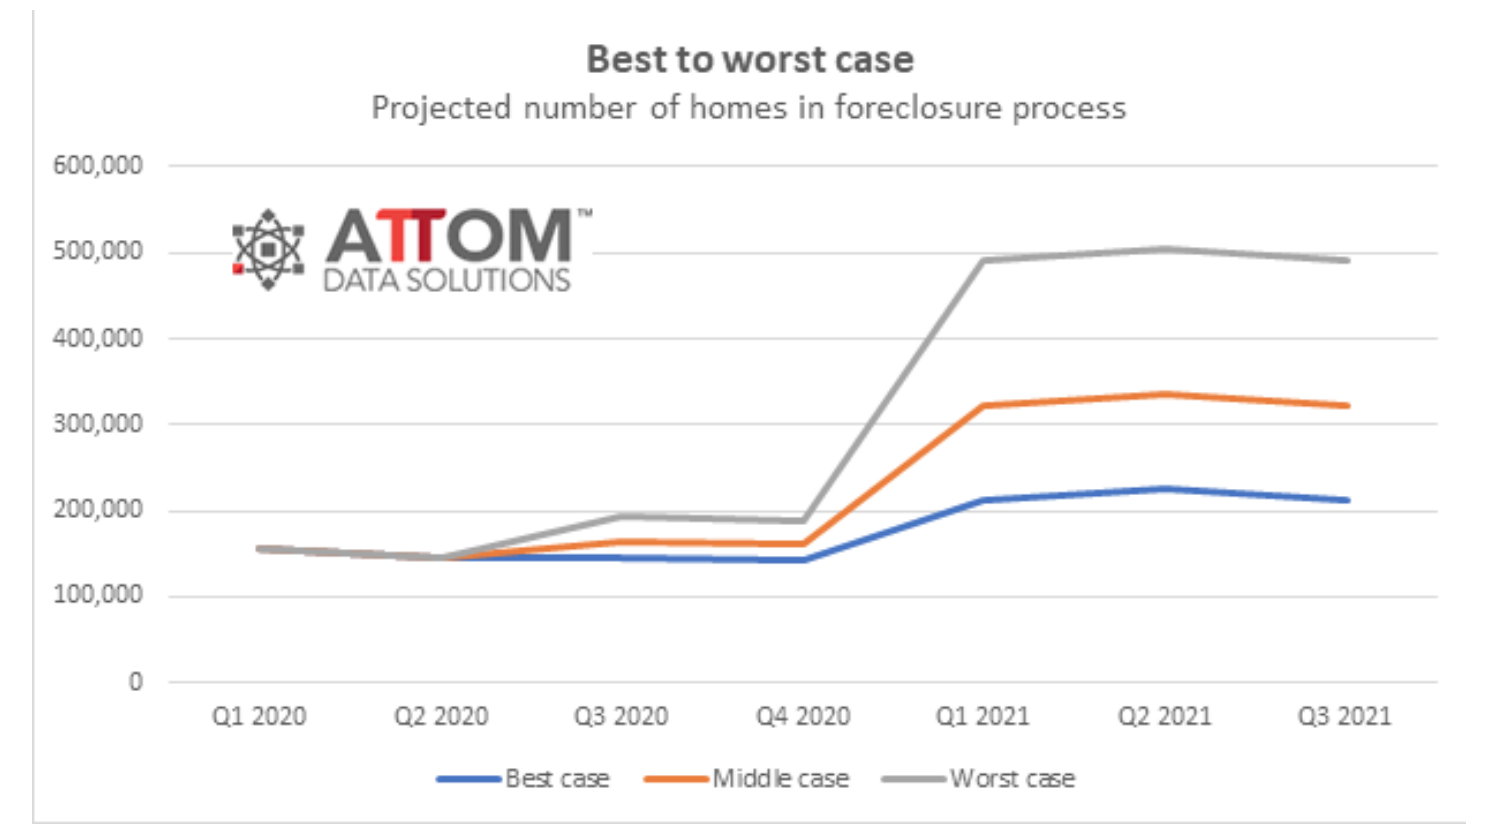
ATTOM Data Solutions released this chart below which predicts how many foreclosures we might see some time later in 2021. I think the middle and best case trajectories are most probable, but with less than one month of inventory currently for sale, I think the market will be able to absorb these foreclosures easily. Time will tell for sure, but you will not catch me waiting for a wave this year.
According to CoreLogic, homes prices are up 10% from January 2020. This marks a very significant increase, as price appreciation has not reached double digits since November 2013.
When Covid-19 initially came to town, many home owners thought homes sales would suffer, propelling a new buyer’s market and a reduction in home prices. I am sheepishly raising my hand to admit that I was in this camp. With a significant dip in the economy and the job losses that followed, who would be moving and buying homes now? Would people be afraid to look for a new home out of fear of getting sick? With new city regulations only allowing essential travel, were sellers even allowed to show their home? These were uncertain times and many questions lingered, so many sellers decided not to list their homes.
Thankfully, for many sellers, the exact opposite market conditions ensued, and the already existing seller’s market became even more fervent. The Federal Reserve lowered interest rates to record lows to help spur the struggling economy. Mortgage rates followed, so many first time home buyers with jobs took advantage of the low rates and jumped into the market. Another factor that contributed to the intensity was the ability to now work from home. With many company headquarters closing, Zooming with employees became the norm to help prevent the spread of Covid-19. Workers were no longer tied to the cities where their companies were located. Many workers chose to relocate from the cramped conditions and overpriced cities to the sprawling suburbs, and can we blame them? With restaurants being shuttered and the entertainment scene hampered indefinitely, what was keeping these workers in the city? Finally, another contributing factor was the change in structure to the family. With many parents working from home and kids now restricted to home schooling, families were feeling a little cramped. They needed bigger homes and different floor plans. Home offices, once a luxury, were now a must. With already low inventory in most of the nation, competition for homes escalated immensely.
Where do we go from here? According to realtor.com, nationwide, the spring market is down 200,000 new listings. There are half as many homes for sale at the end of February compared to a year earlier. One of the reasons for lower inventory is severe weather in much of the country. But I think the biggest contributing factor is the surge in home sales in 2020. In Charleston alone, home sales were up 19% from 2019. Sellers noticed the price appreciation and low interest rates and took advantage of it.
To catch up, new listings would have to grow by 25% annually in March and April, which is unlikely. – Diana Olick of CNBC
In Charleston, as of March 6th, we have 1,713 homes currently active in the Charleston Trident Multiple Listing Service. Last year, a banner year for home sales, 22,144 homes sold, which means on average, 1,845 homes sold every month. Noticeably, we have less than one month of inventory to sell. If we average 2018 and 2019 home sales, which were closer to normal rates, we still have only about one month of inventory. A normal healthy market has six months of inventory available. The market is hot and is going to stay on fire!
Will we see another double digit price appreciation for 2021? CoreLogic is only predicting a 3.3% increase in home prices this year nationally. Affordability is one of the hurdles for many buyers. With enormous price appreciation, first time home buyers, which make up the largest percentage of home sales, may no longer be able to afford to buy a home. The other hurdle is the availability of homes to buy. With many city governments advocating for and enacting policies to hamper growth, along with the scarcity of available land in many areas, builders will not be able to keep up with the demand. This just means that economists are expecting fewer homes to be sold in 2021, which will slow price appreciation for the year.
So far, Charleston is not following this predicted trajectory. In the first two months of 2021, 3,093 homes have sold compared to 2,488 in the same two months of last year. This will definitely be a year to follow in real estate!
Graph: CoreLogic Home Price Insights report, March 2, 2021
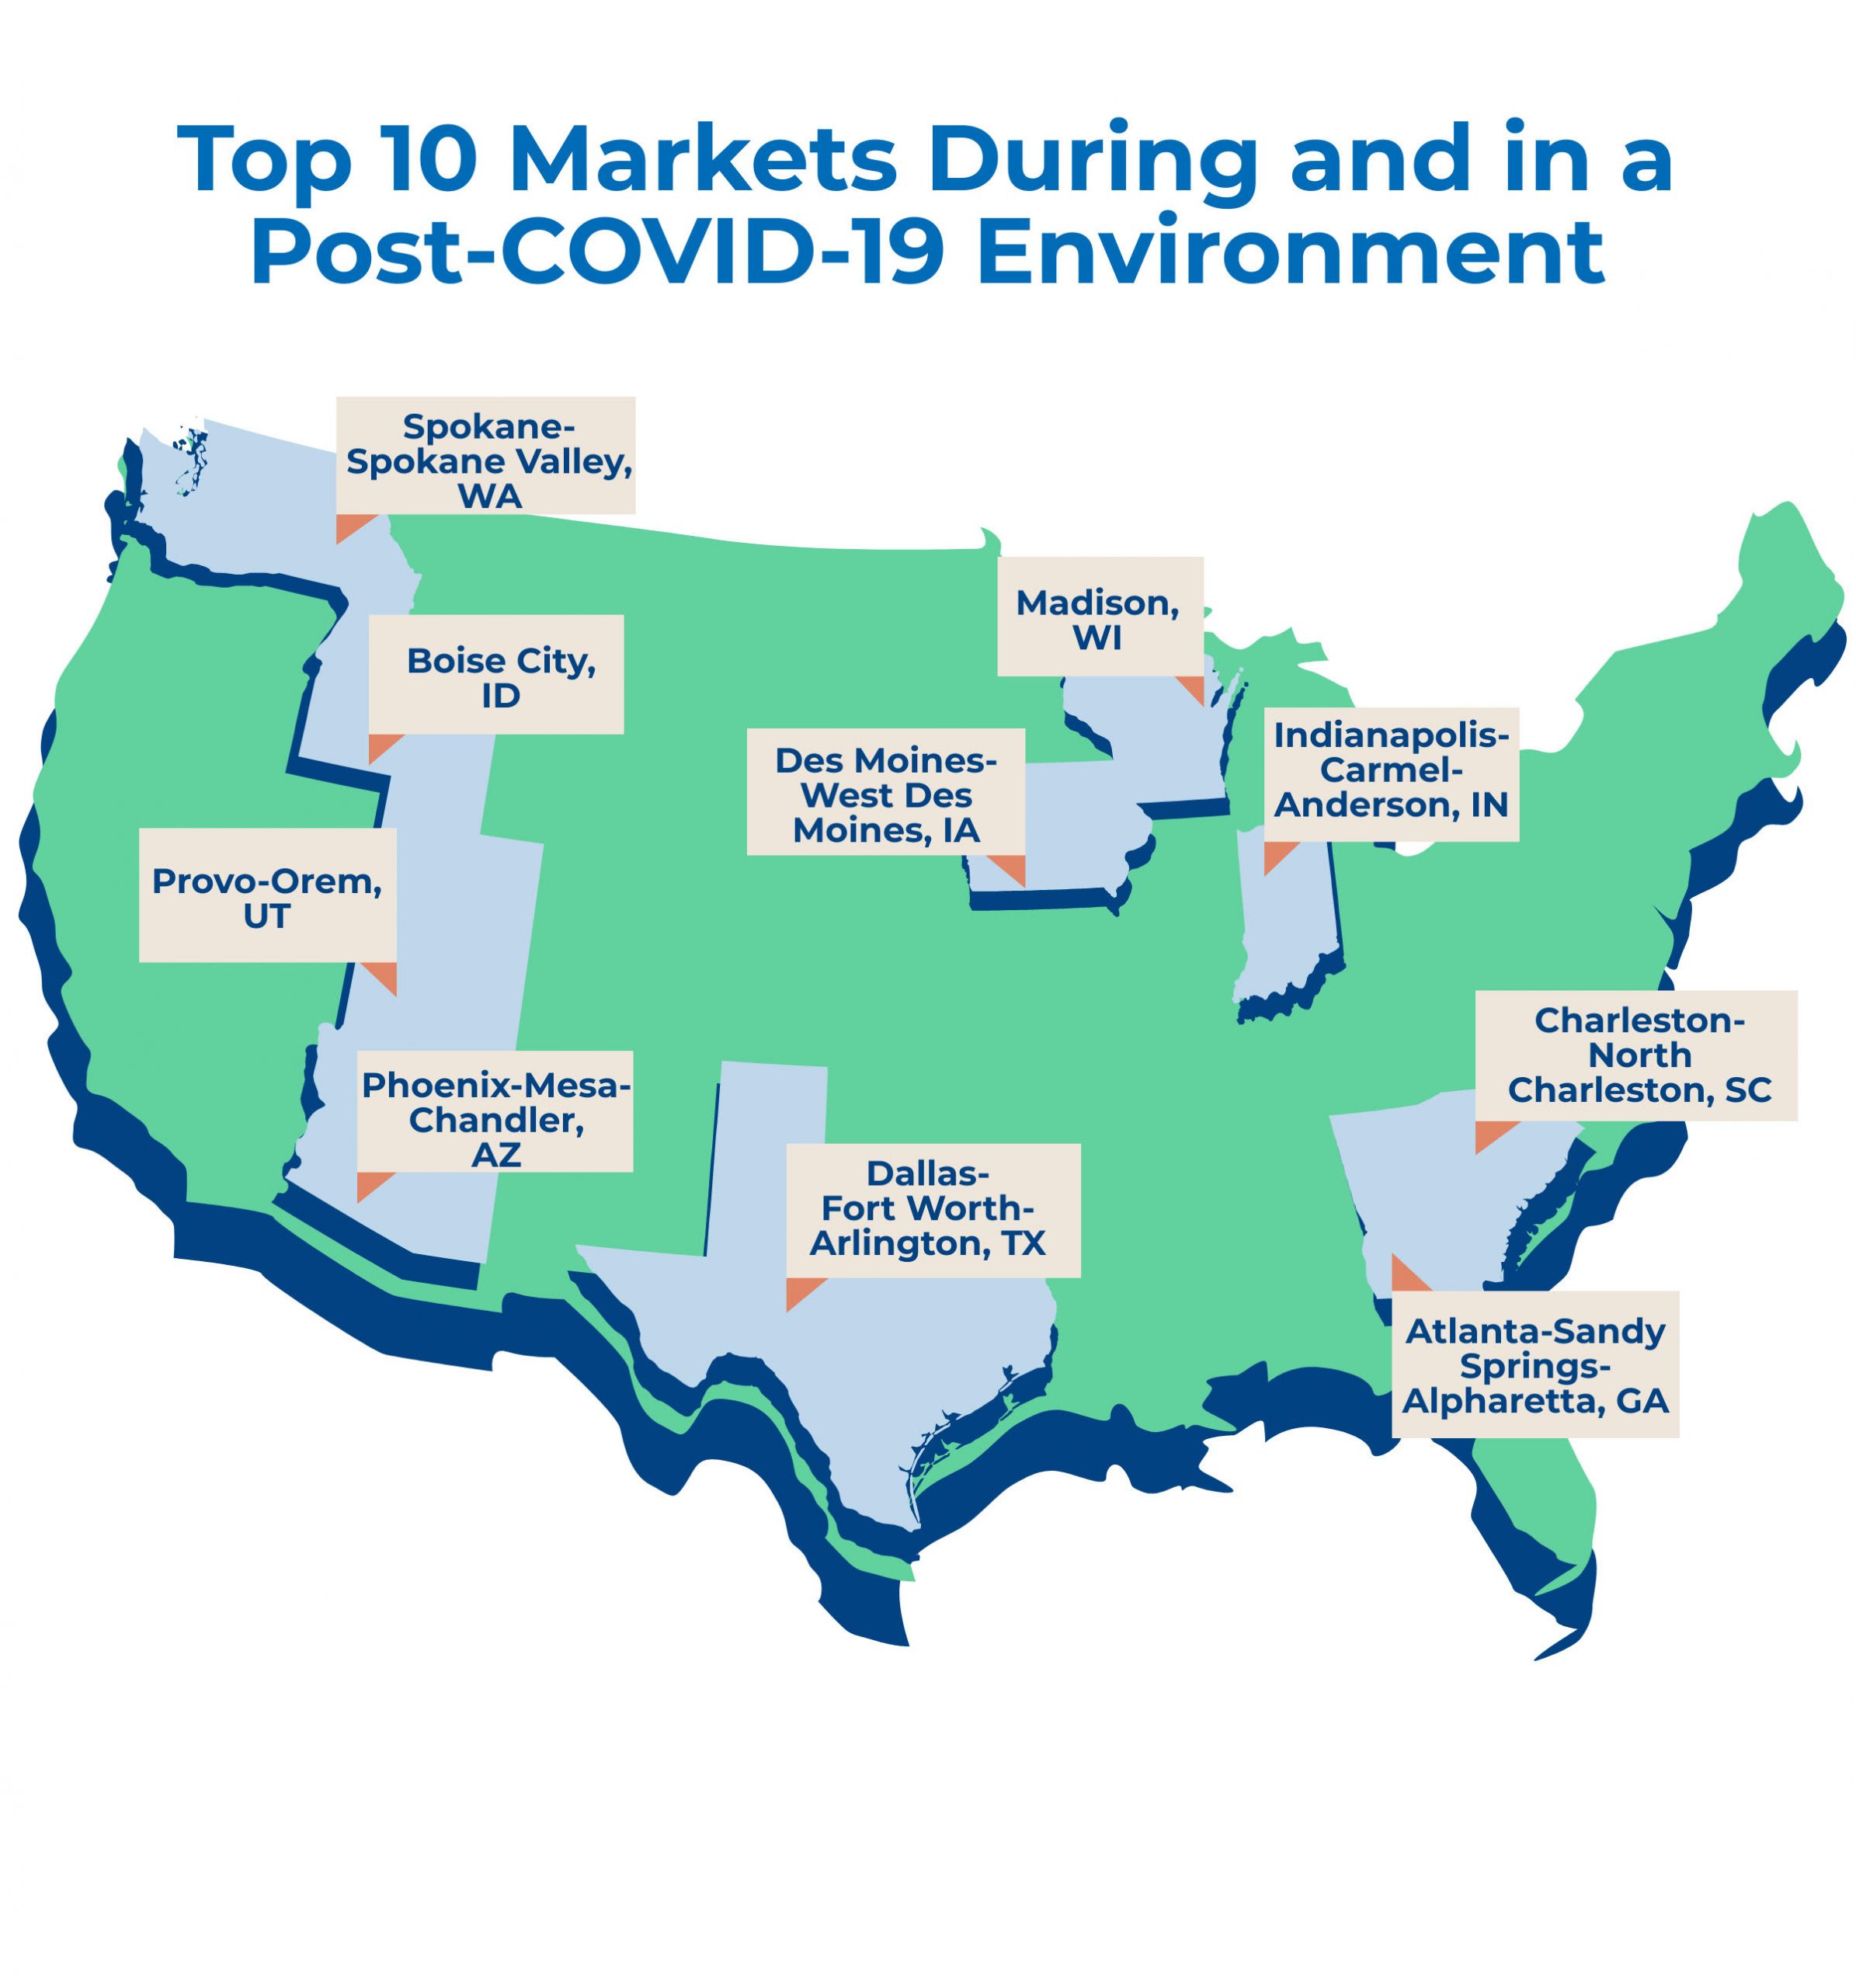
The National Association of Realtors Research Group identified Charleston-North Charleston as one of the top ten real estate markets during and in a post-Covid environment.
The metrics they examined in their study are as follows:
1) Fraction of the workforce working from home (2019)
2) Share of multi-generational households (2019)
3) Net domestic migration in a metro area (2019)
4) Movers from expensive West Coast areas moving into another metro area (2018)
5) Unemployment rate (September 2020)
6) Share of workers in retail trade, leisure and hospitality industries (2019)
7) Small business openings relative to January 2020 (Nov 2020)
8) Mobility to retail and recreation places relative to January 2020 (Nov 2020)
So why did the Charleston metro area make the list? Charleston has a low unemployment rate of 4.7%, which is well below the national rate of 7.9%. The hospitality and travel industries were some of the industries most affected by layoffs during the pandemic, and while 21.1% of the total workforce in Charleston accounts for these industries, Charlestonians are going to restaurants and recreational places at a greater rate than the average nationally. Even though the amount of residents going to restaurants and leisure activities is down 13% from pre-pandemic levels, the national average is down 20%. Having good weather, which makes outdoor activities and social distancing more of a possibility, and having a city government less restrictive to shutdowns has helped widen that gap.
Another worthy statistic to note is that the net migration to Charleston in 2019 was 10,340, which ranks it just behind the much larger metro areas of Atlanta, Boise, Phoenix, and Dallas. Charleston is a popular place.
The other metropolis areas that made the list (in alphabetical order):
Atlanta-Sandy Springs-Alpharetta, GA
Boise City, ID
Dallas-Fort Worth-Arlington, TX
Des Moines-West Des Moines, IA
Indianapolis-Carmel-Anderson, IN
Madison, WI
Phoenix-Mesa-Chandler, AZ
Provo-Orem, UT
Spokane-Spokane Valley, WA

